BuildDaily

Analytics

Analytics that tells a contractor where the work is slipping

Analytics turns BuildDaily records into an operating review: which leads are going cold, which bids are missing pieces, which jobs are dragging cash or RFIs, which service tickets are testing SLA and billing discipline, where labor is double-booked, and which markets are producing real pursuit value.

Analytics Workflow

The boards are organized around contractor decisions

Executive: decide what deserves attention first

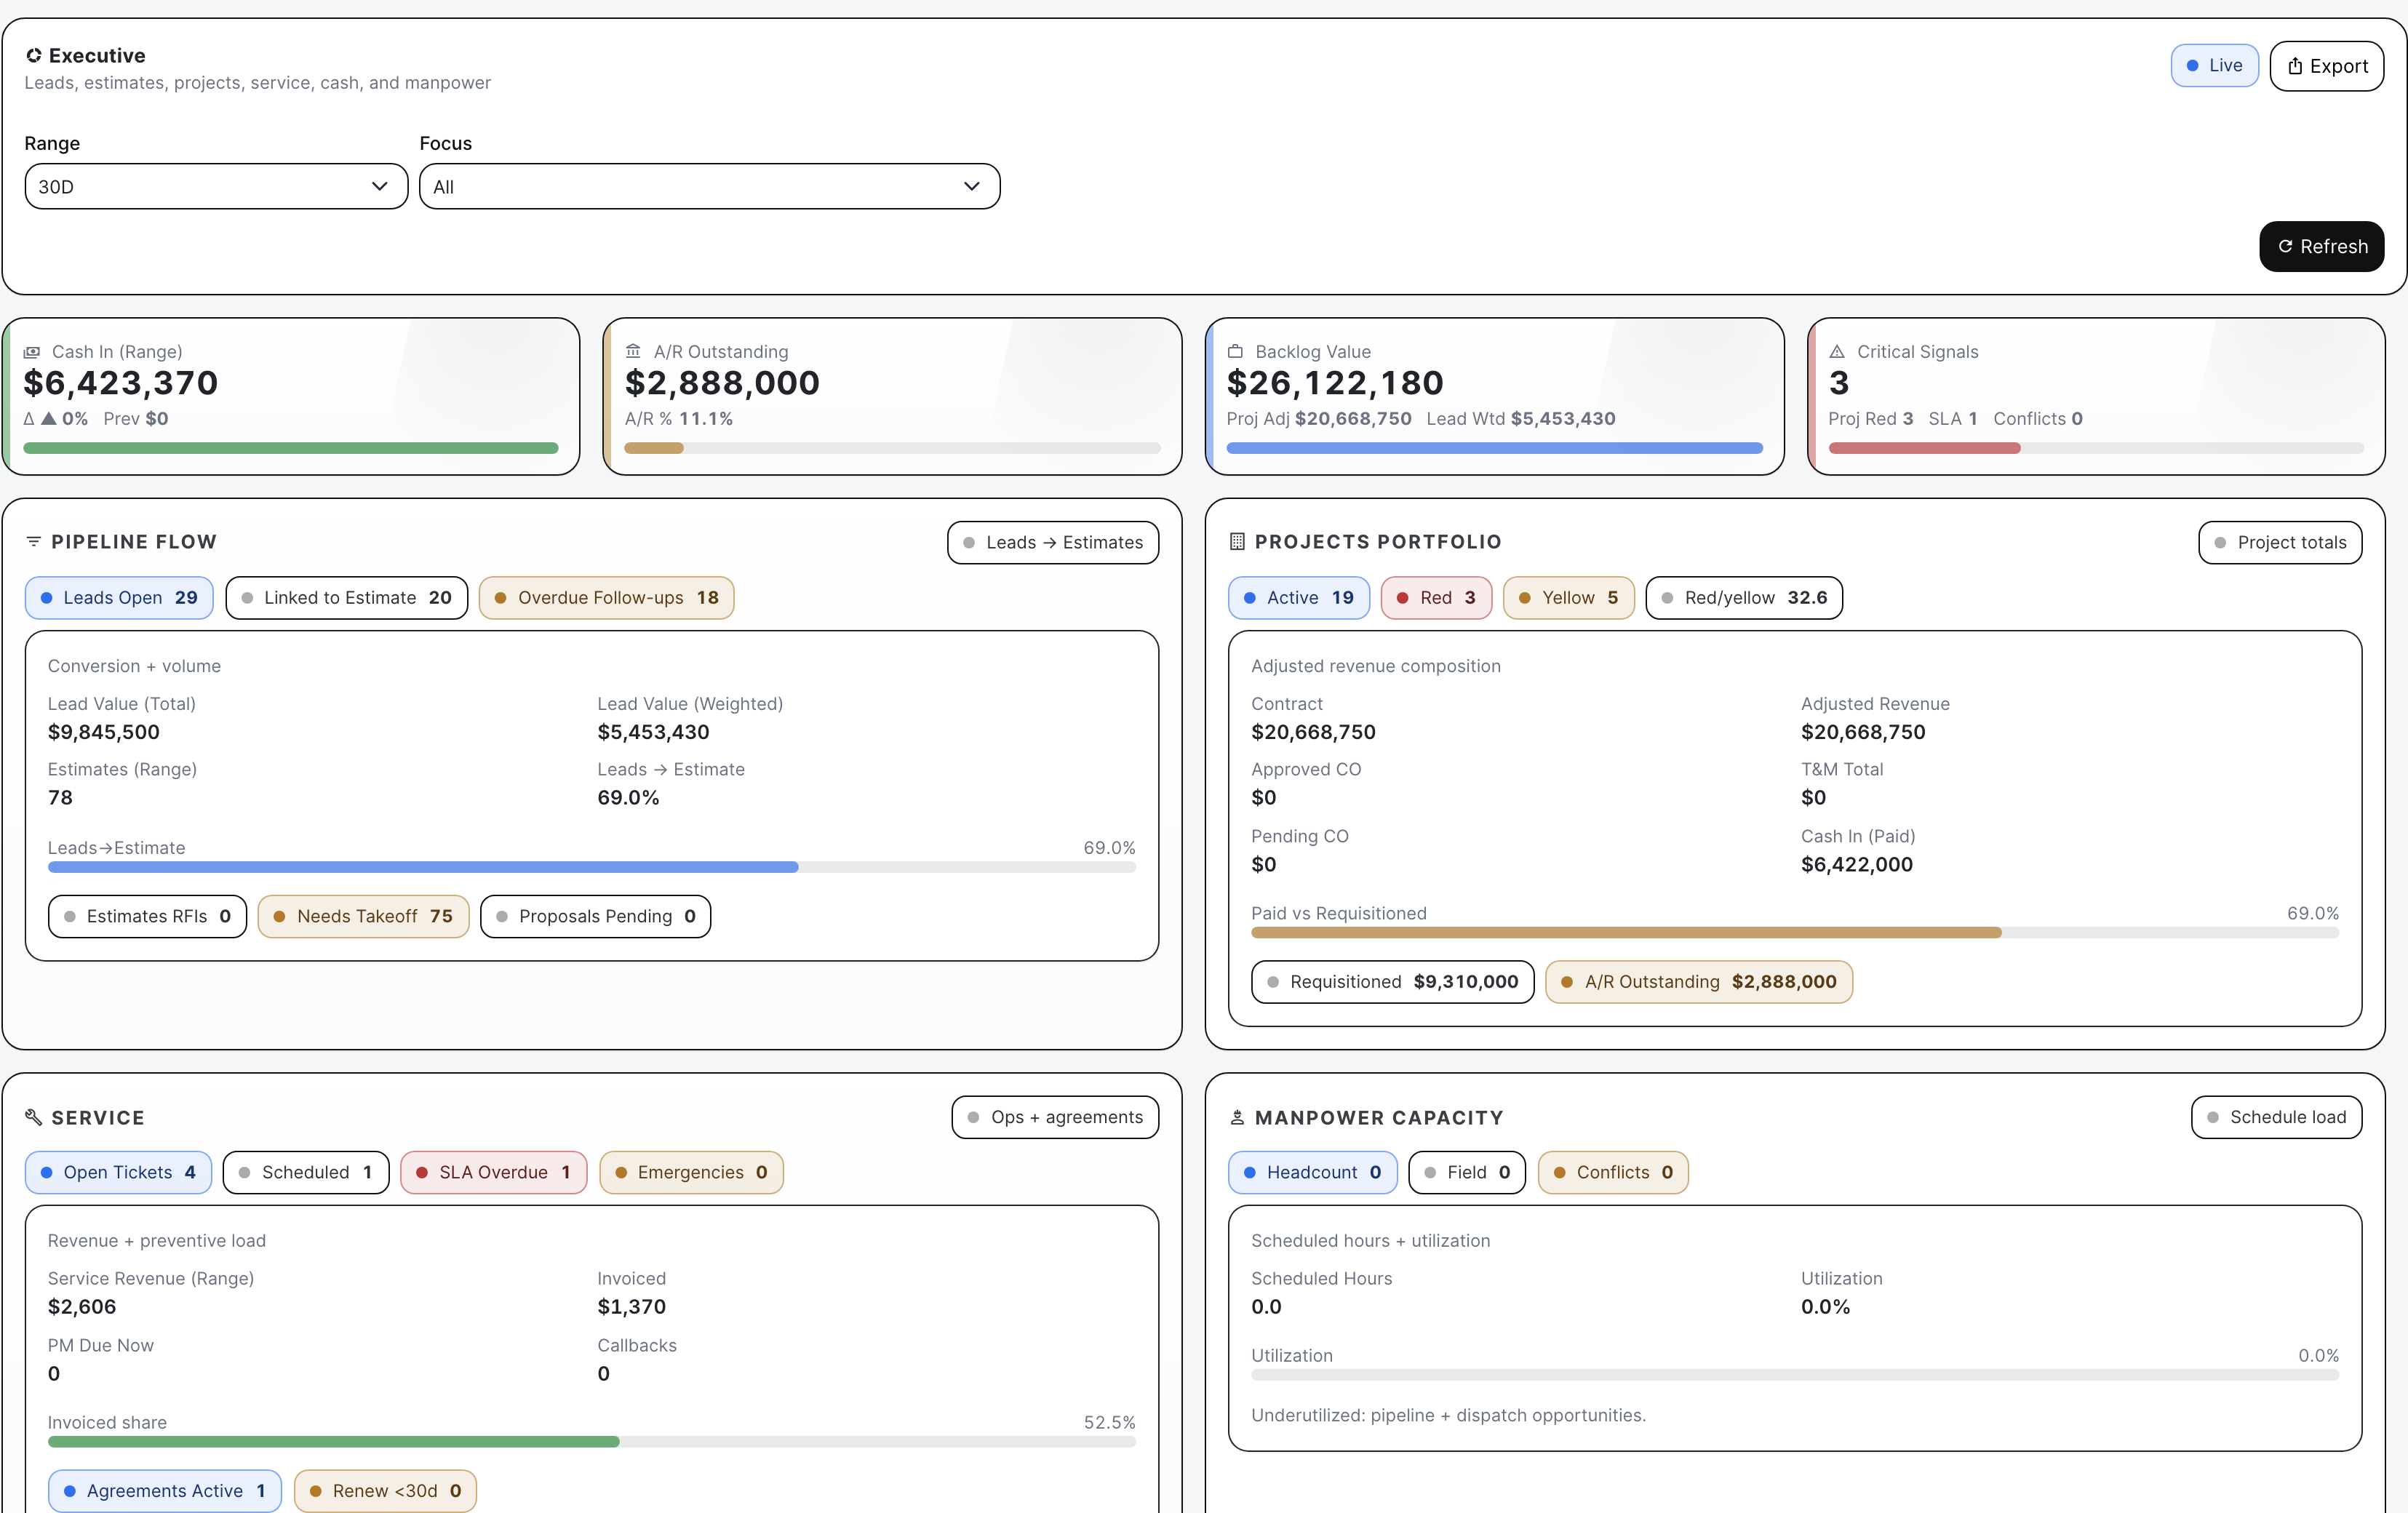
Owners and operators start with the executive board when they need a plain read on the week. It rolls leads, estimates, projects, service, cash, backlog, and manpower into signals a contractor can act on: overdue follow-ups, project red/yellow counts, A/R pressure, SLA breaches, and crew conflicts.

  • Compare cash in, A/R, backlog, service pressure, project risk, and manpower capacity
  • Use board checks to see the warning signs before opening department boards
  • Focus the morning meeting on records that can cost money or labor
Executive analytics
Executive analytics gives leadership the cross-module pressure read.

Leads and geography: protect the pursuit pipeline

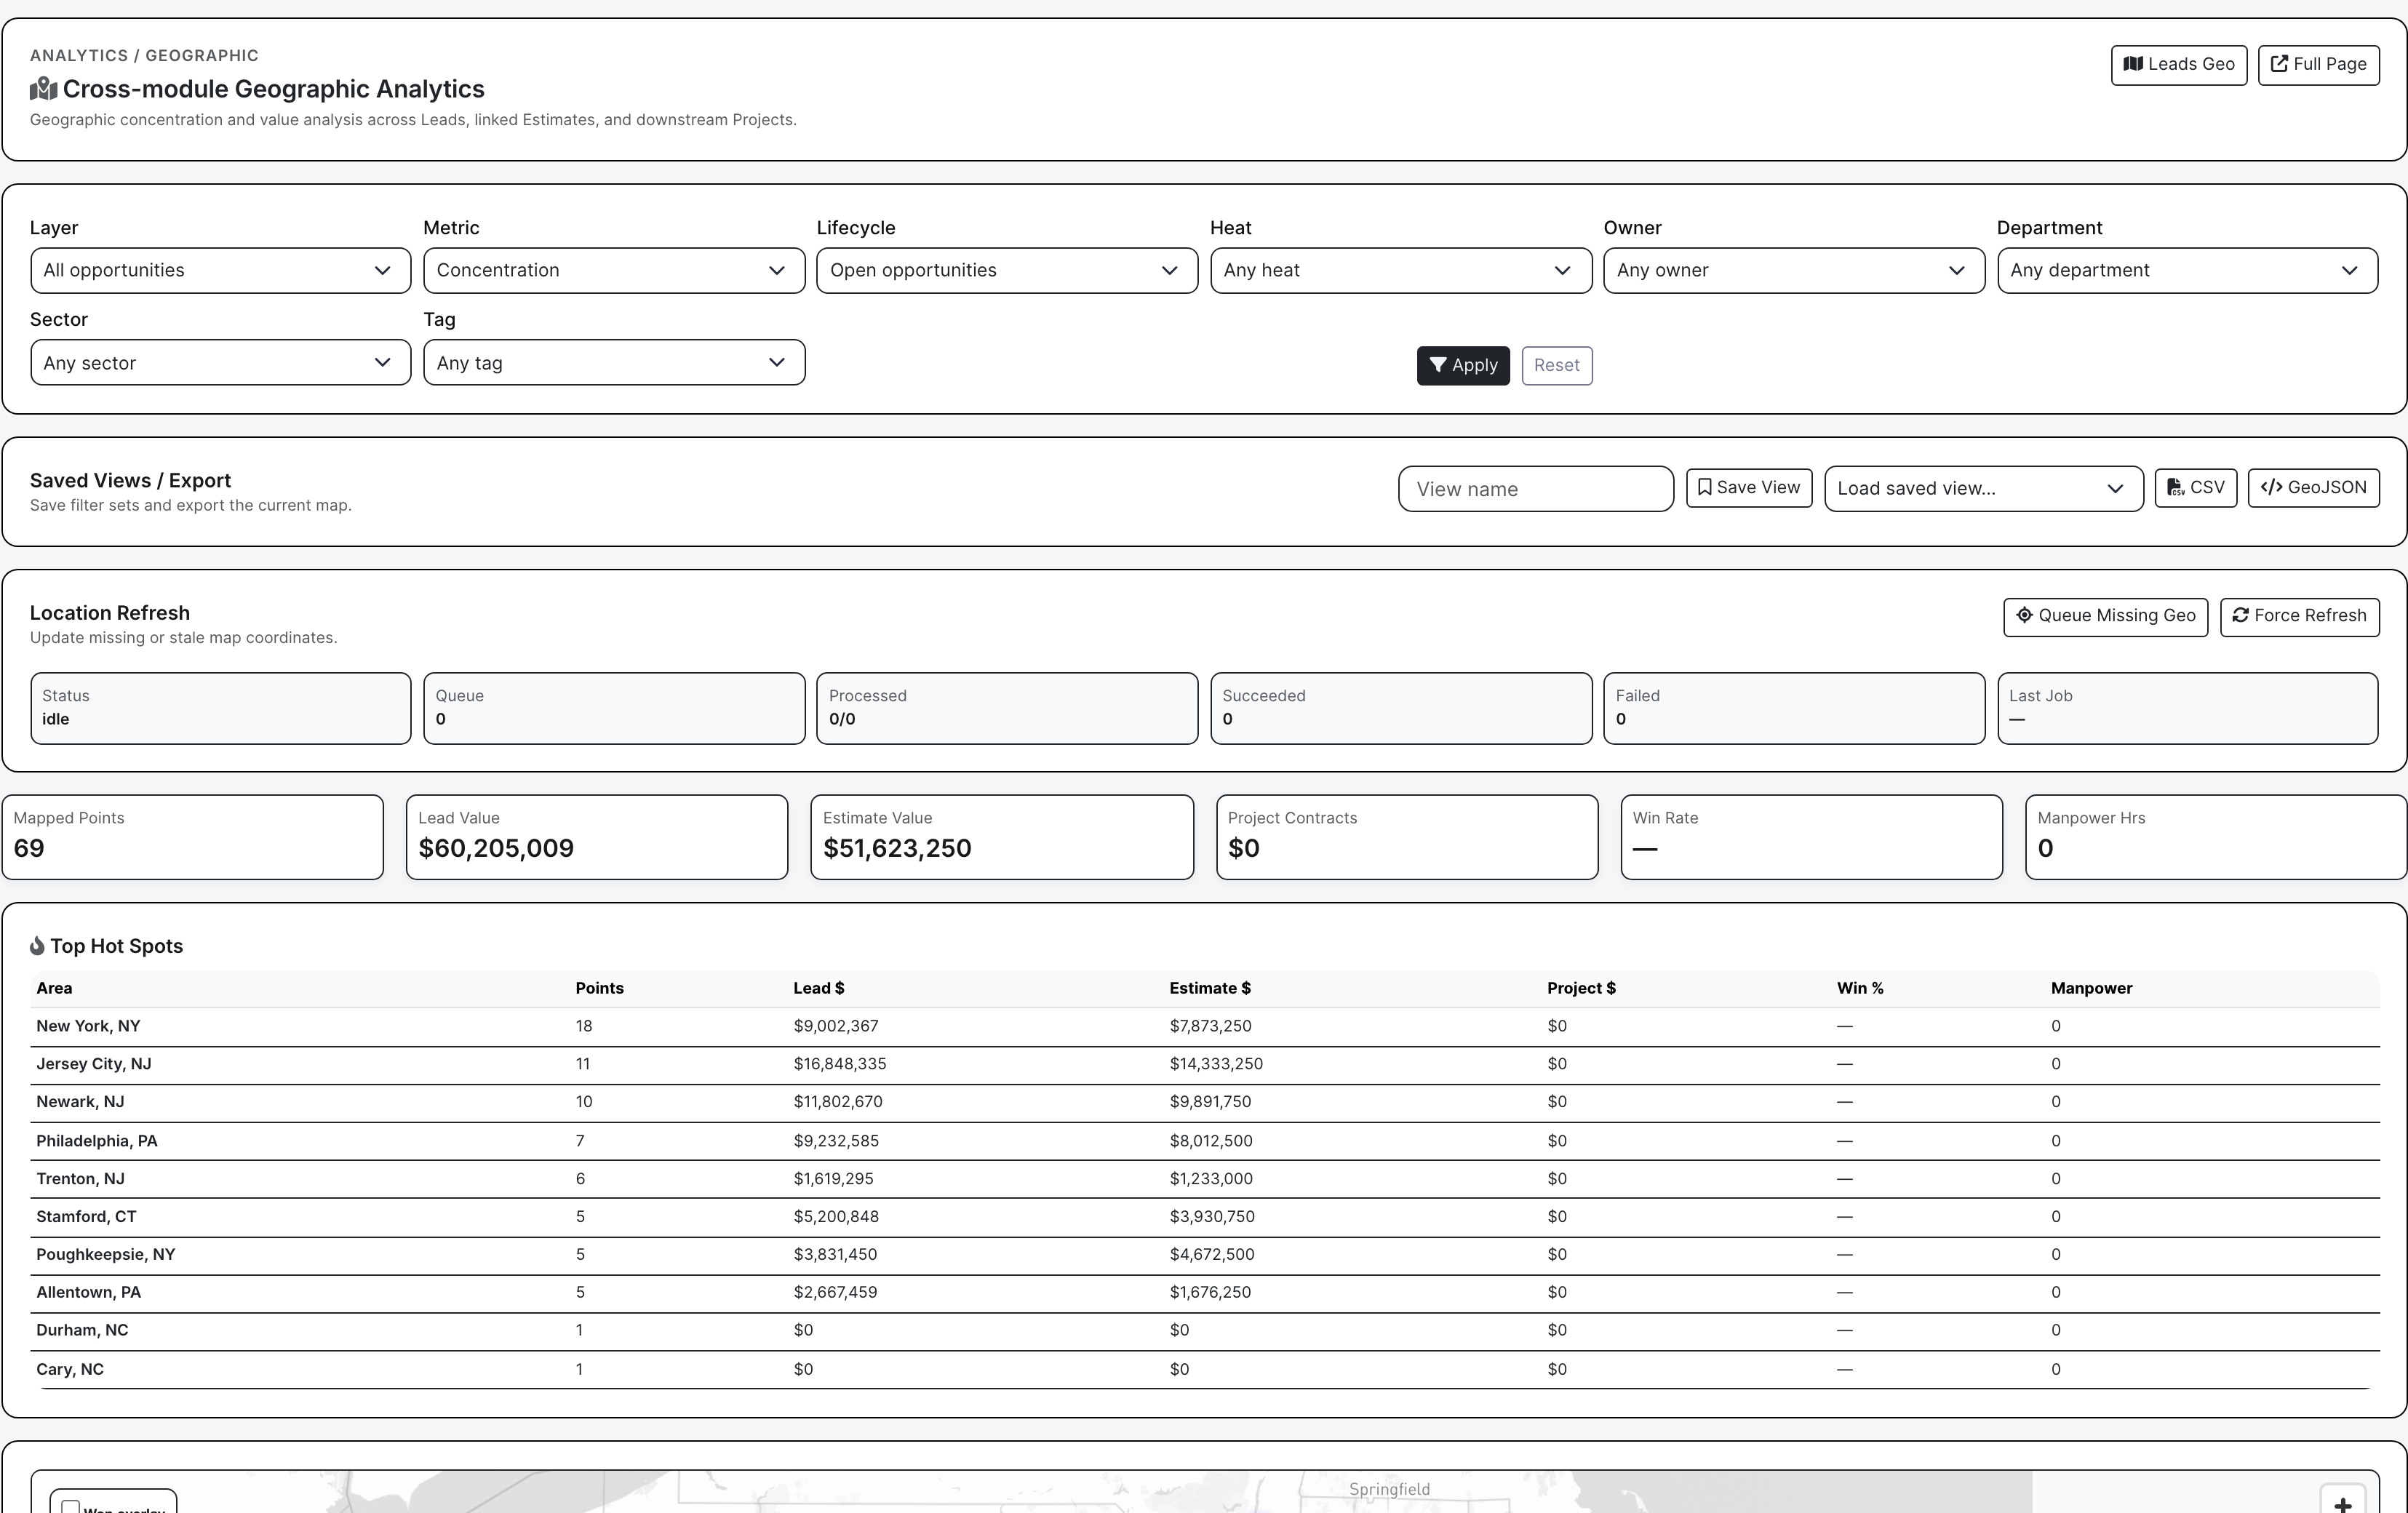
Sales and preconstruction teams can see whether open leads are assigned, whether follow-ups are overdue, whether proposals and values are covered, and which regions are producing opportunity. Geography adds market concentration, hot spots, saved views, CSV export, and GeoJSON export for territory planning.

  • Find stale pursuits and unassigned follow-up before the owner goes quiet
  • Separate pipeline value from weighted value and proposal coverage
  • Use hot spots and exports for territory reviews or owner meetings
Lead analytics
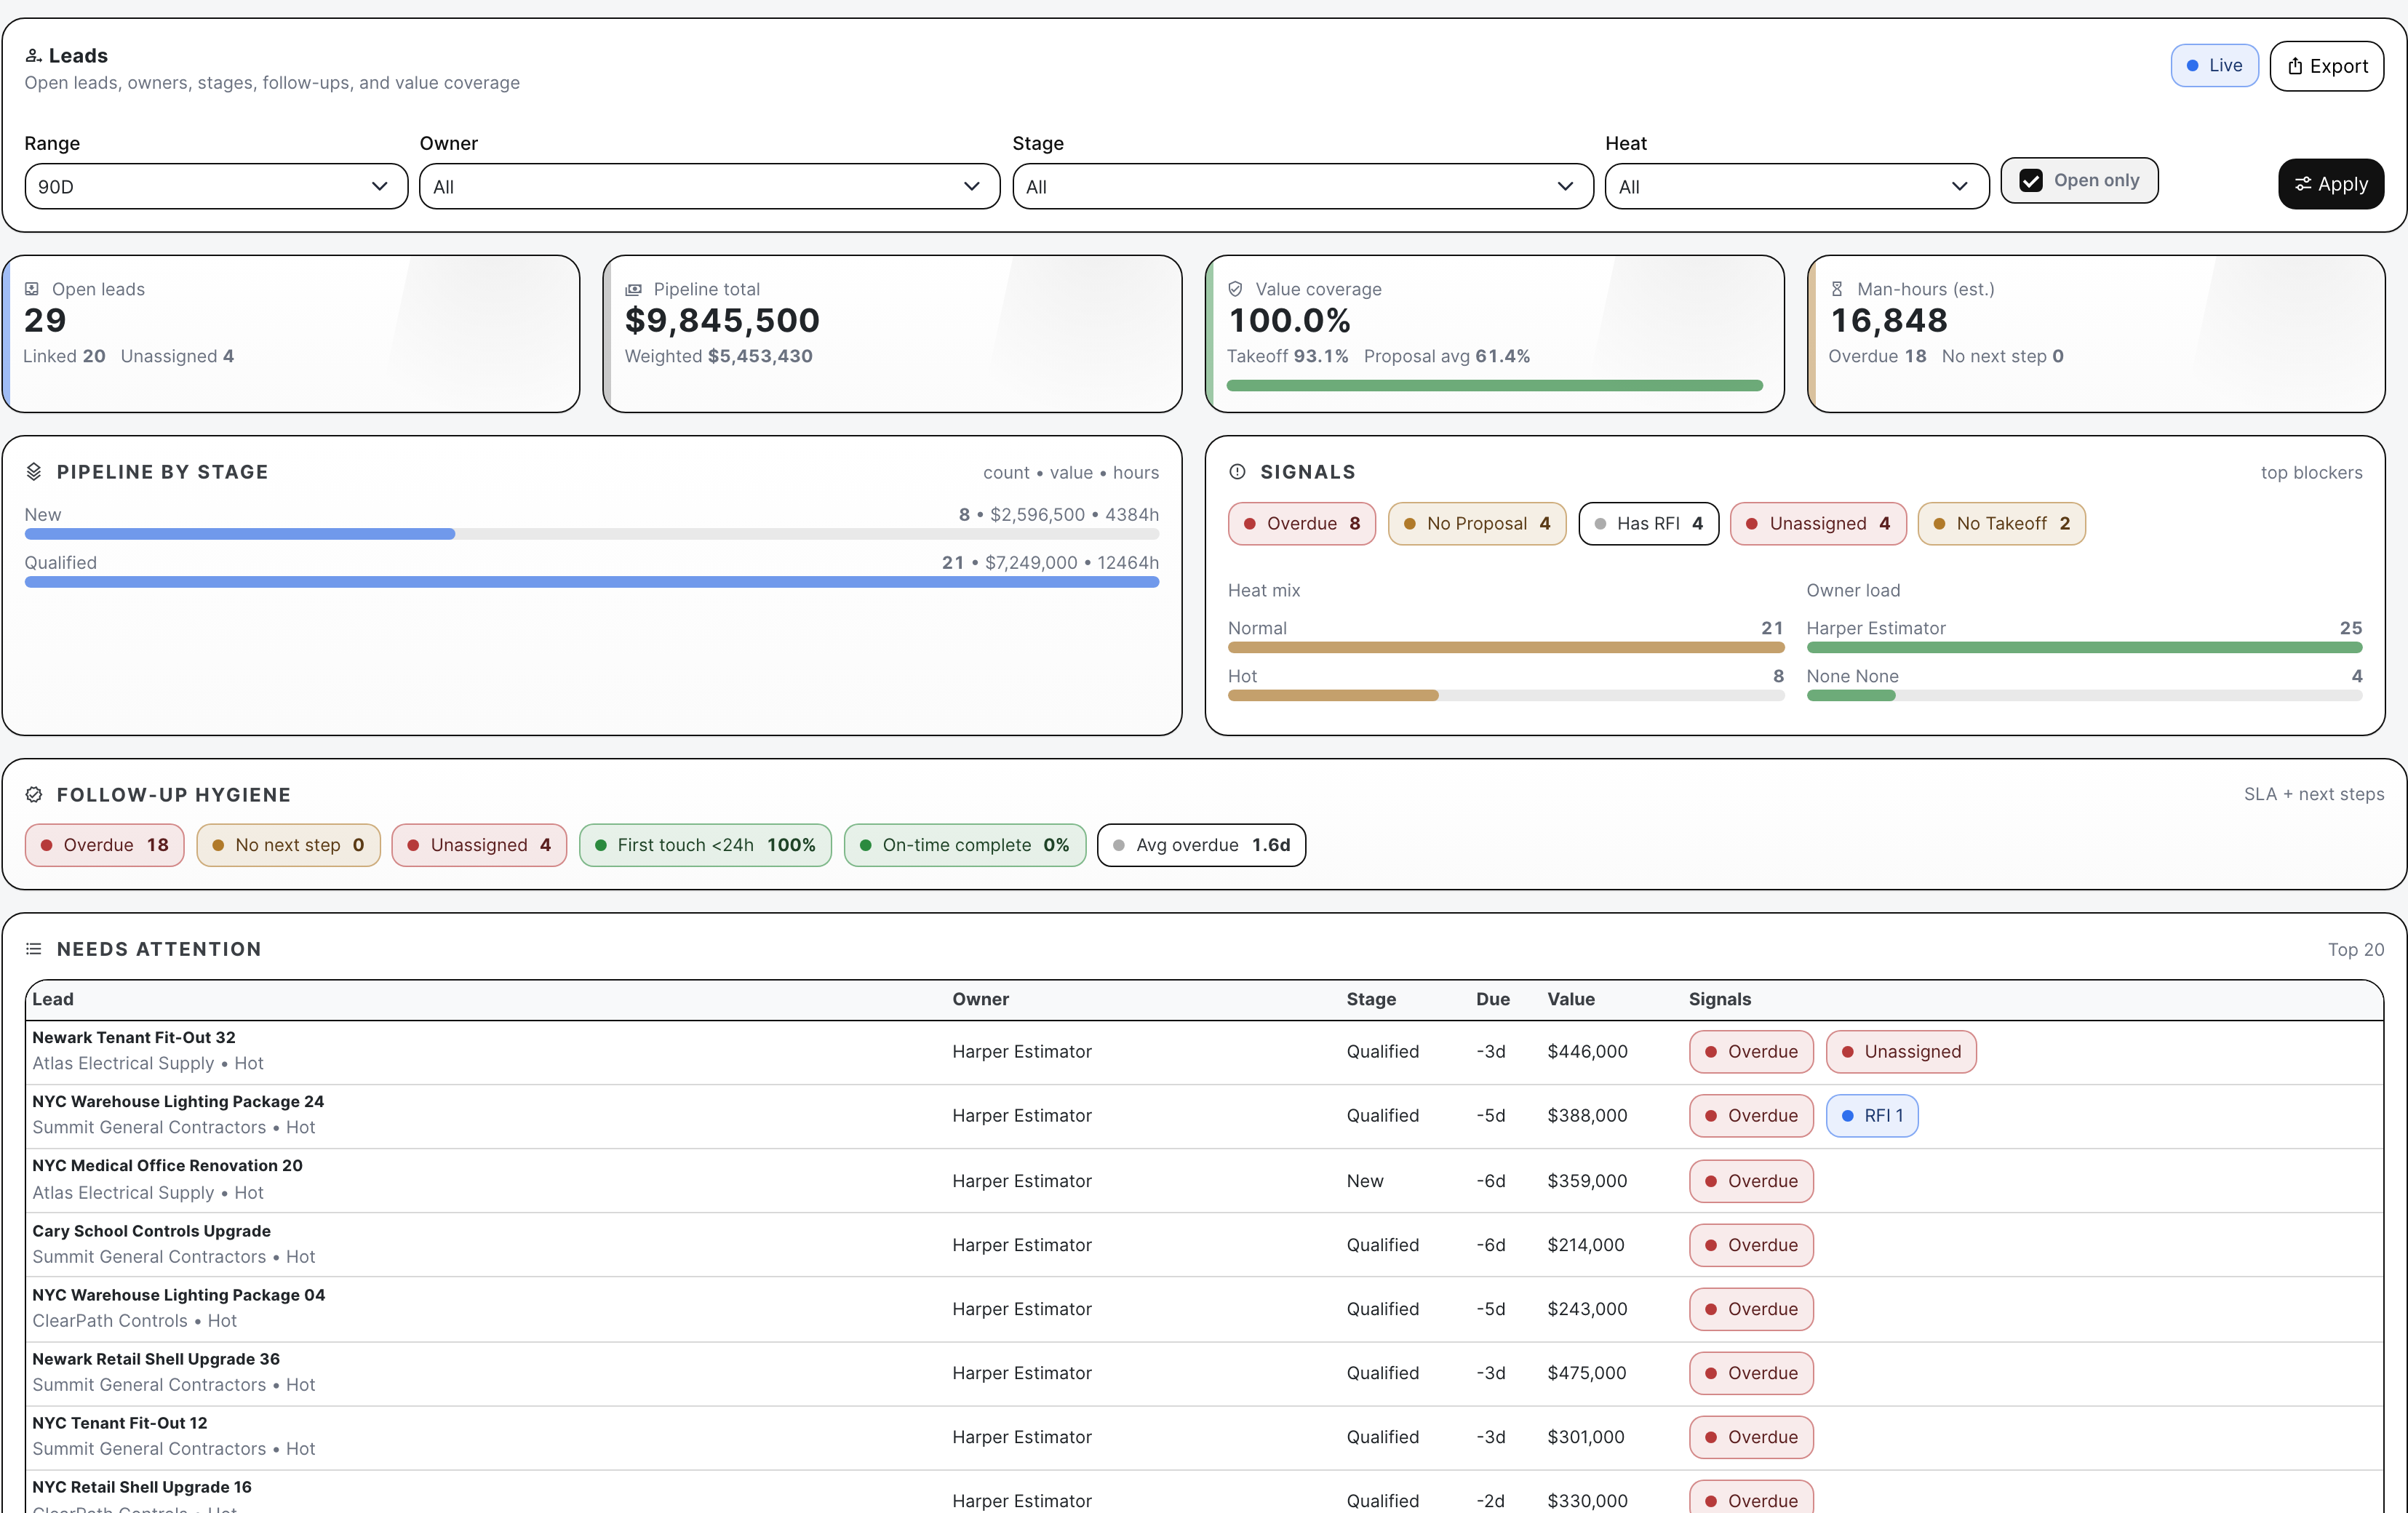
Lead analytics is the cleanup list for pursuits that need action.

Estimating: catch the bid that looks busy but is not ready

Estimating analytics looks past a long bid list and asks whether the bid can actually go out: due windows, proposal sent rate, missing takeoff, no price, no proposal, open RFIs, low quote coverage, stuck bidders, and delivery state.

  • Sort bid risk by blocker instead of waiting for the due date
  • See RFP quote rate and vendor response health
  • Keep proposal and bid-letter delivery visible enough to fix
Estimating analytics
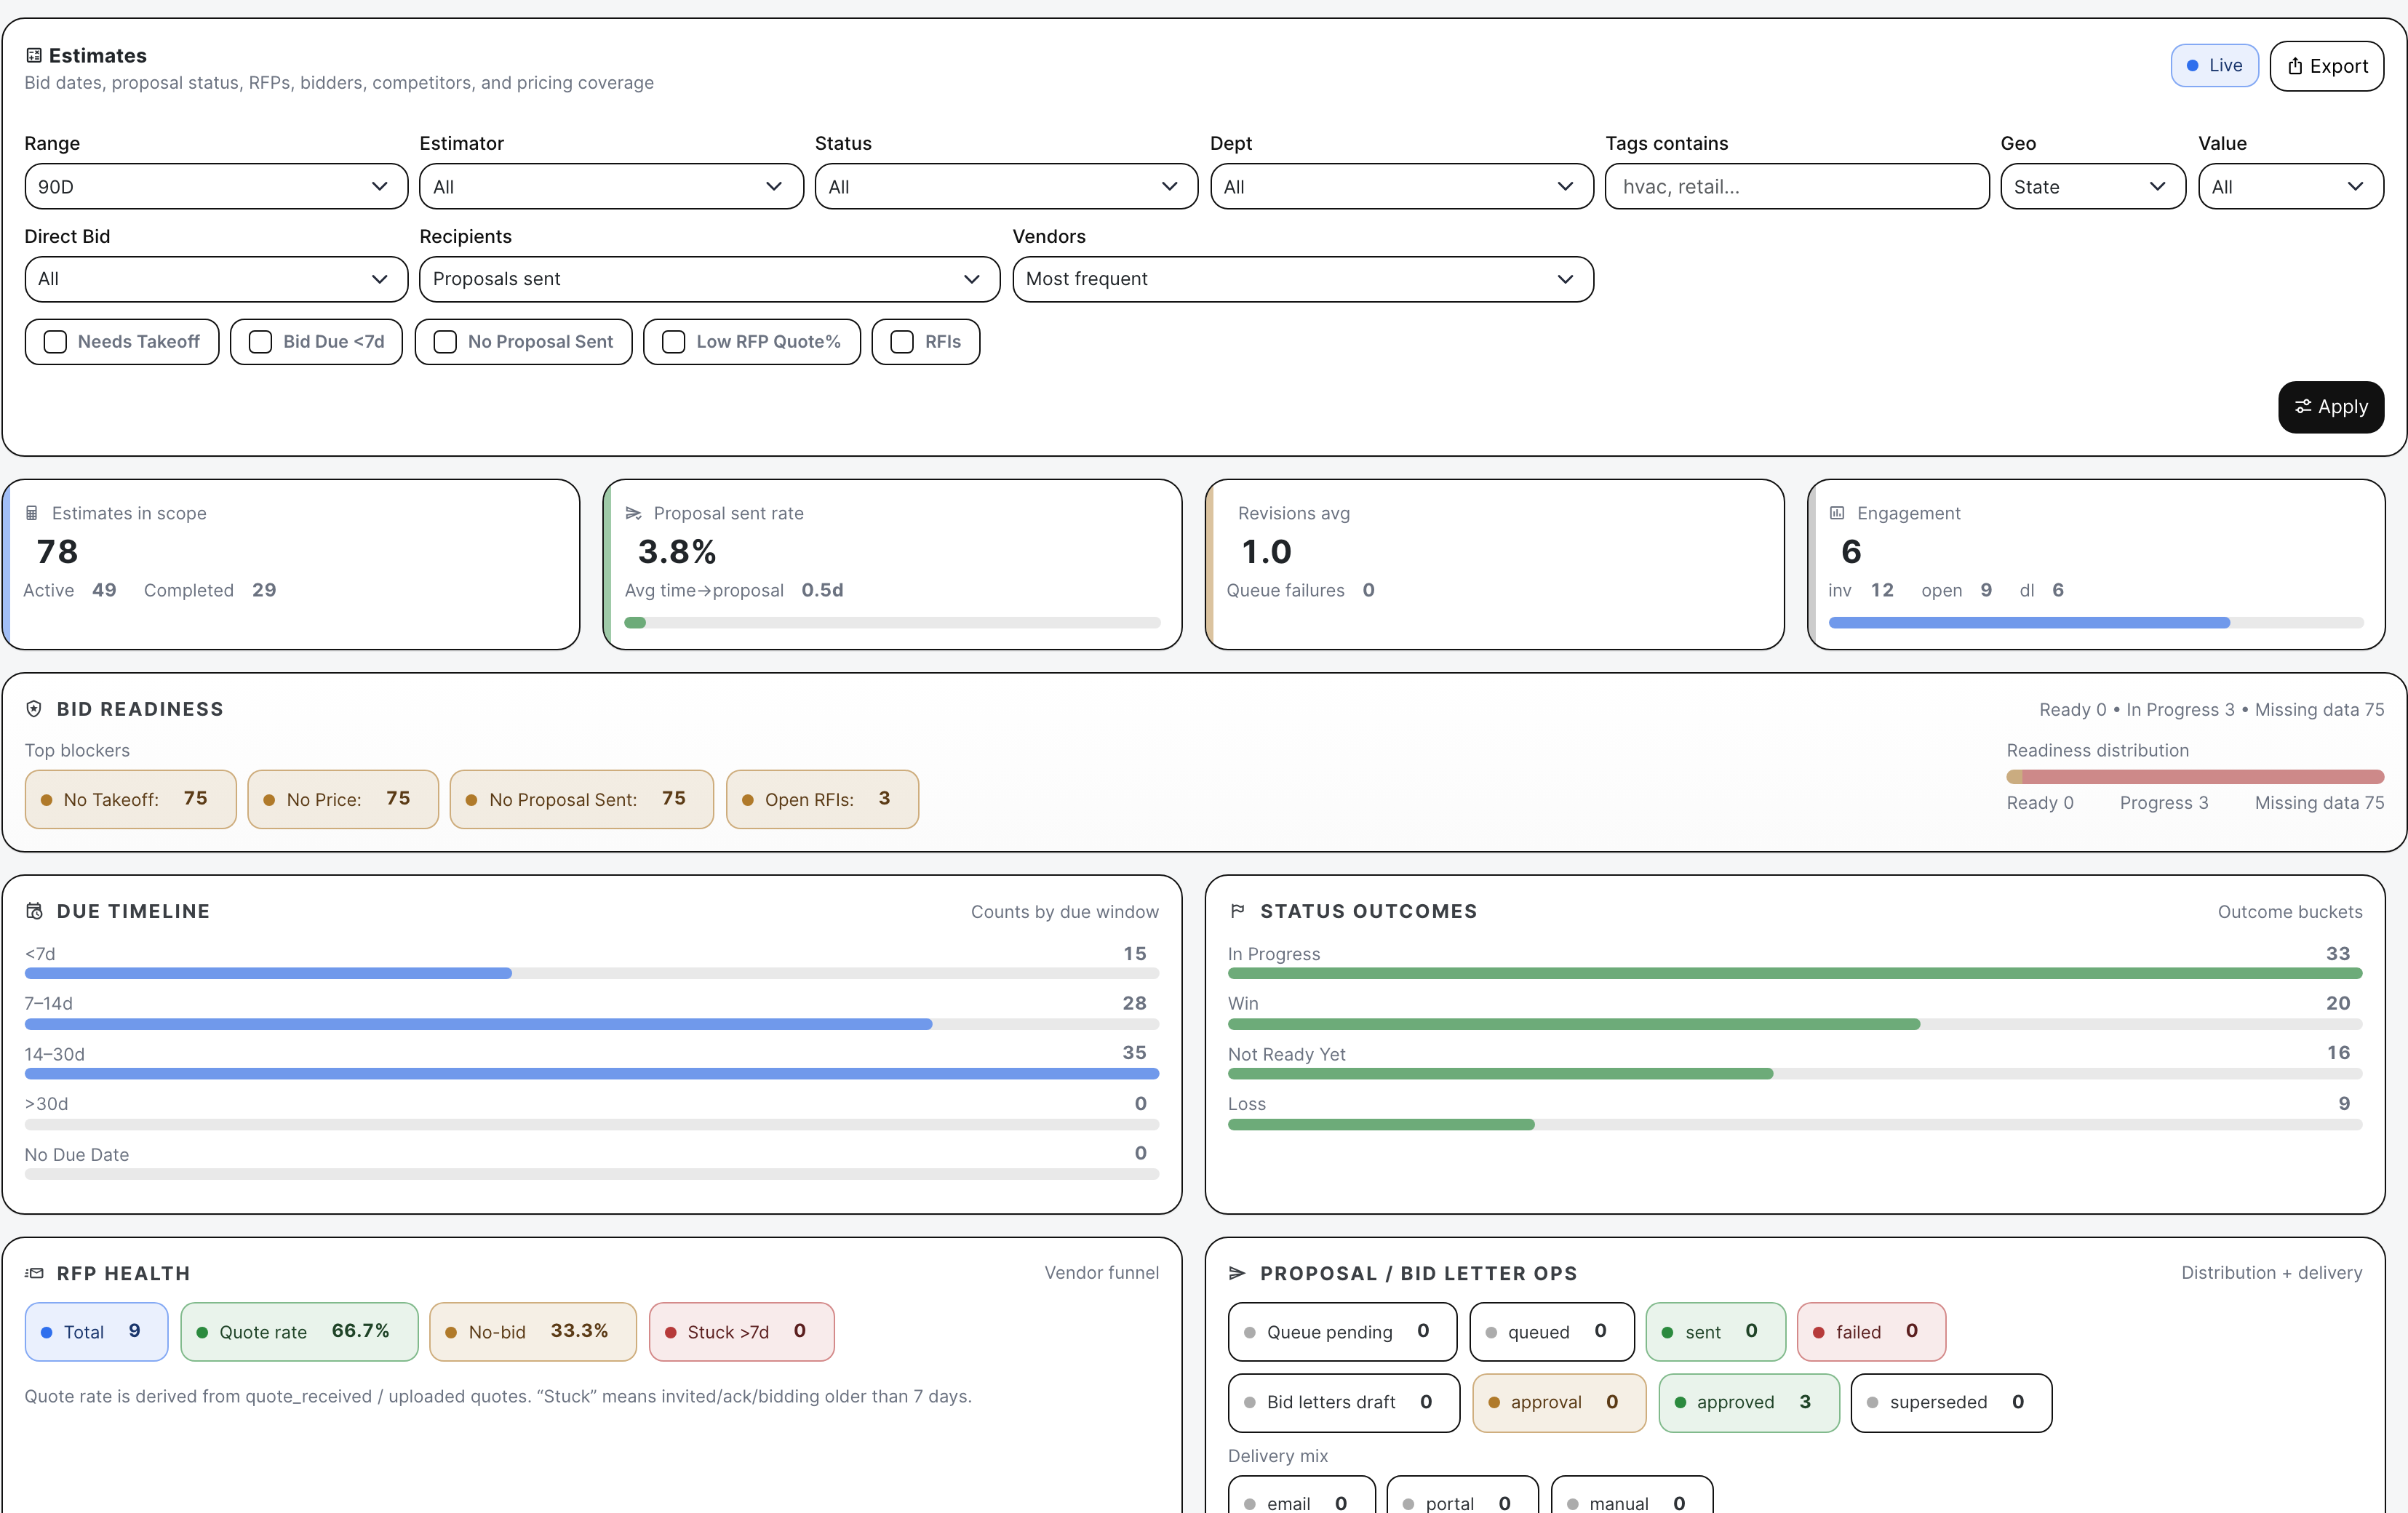
Estimating analytics turns bid activity into readiness checks.

Projects and service: follow the money and the commitments

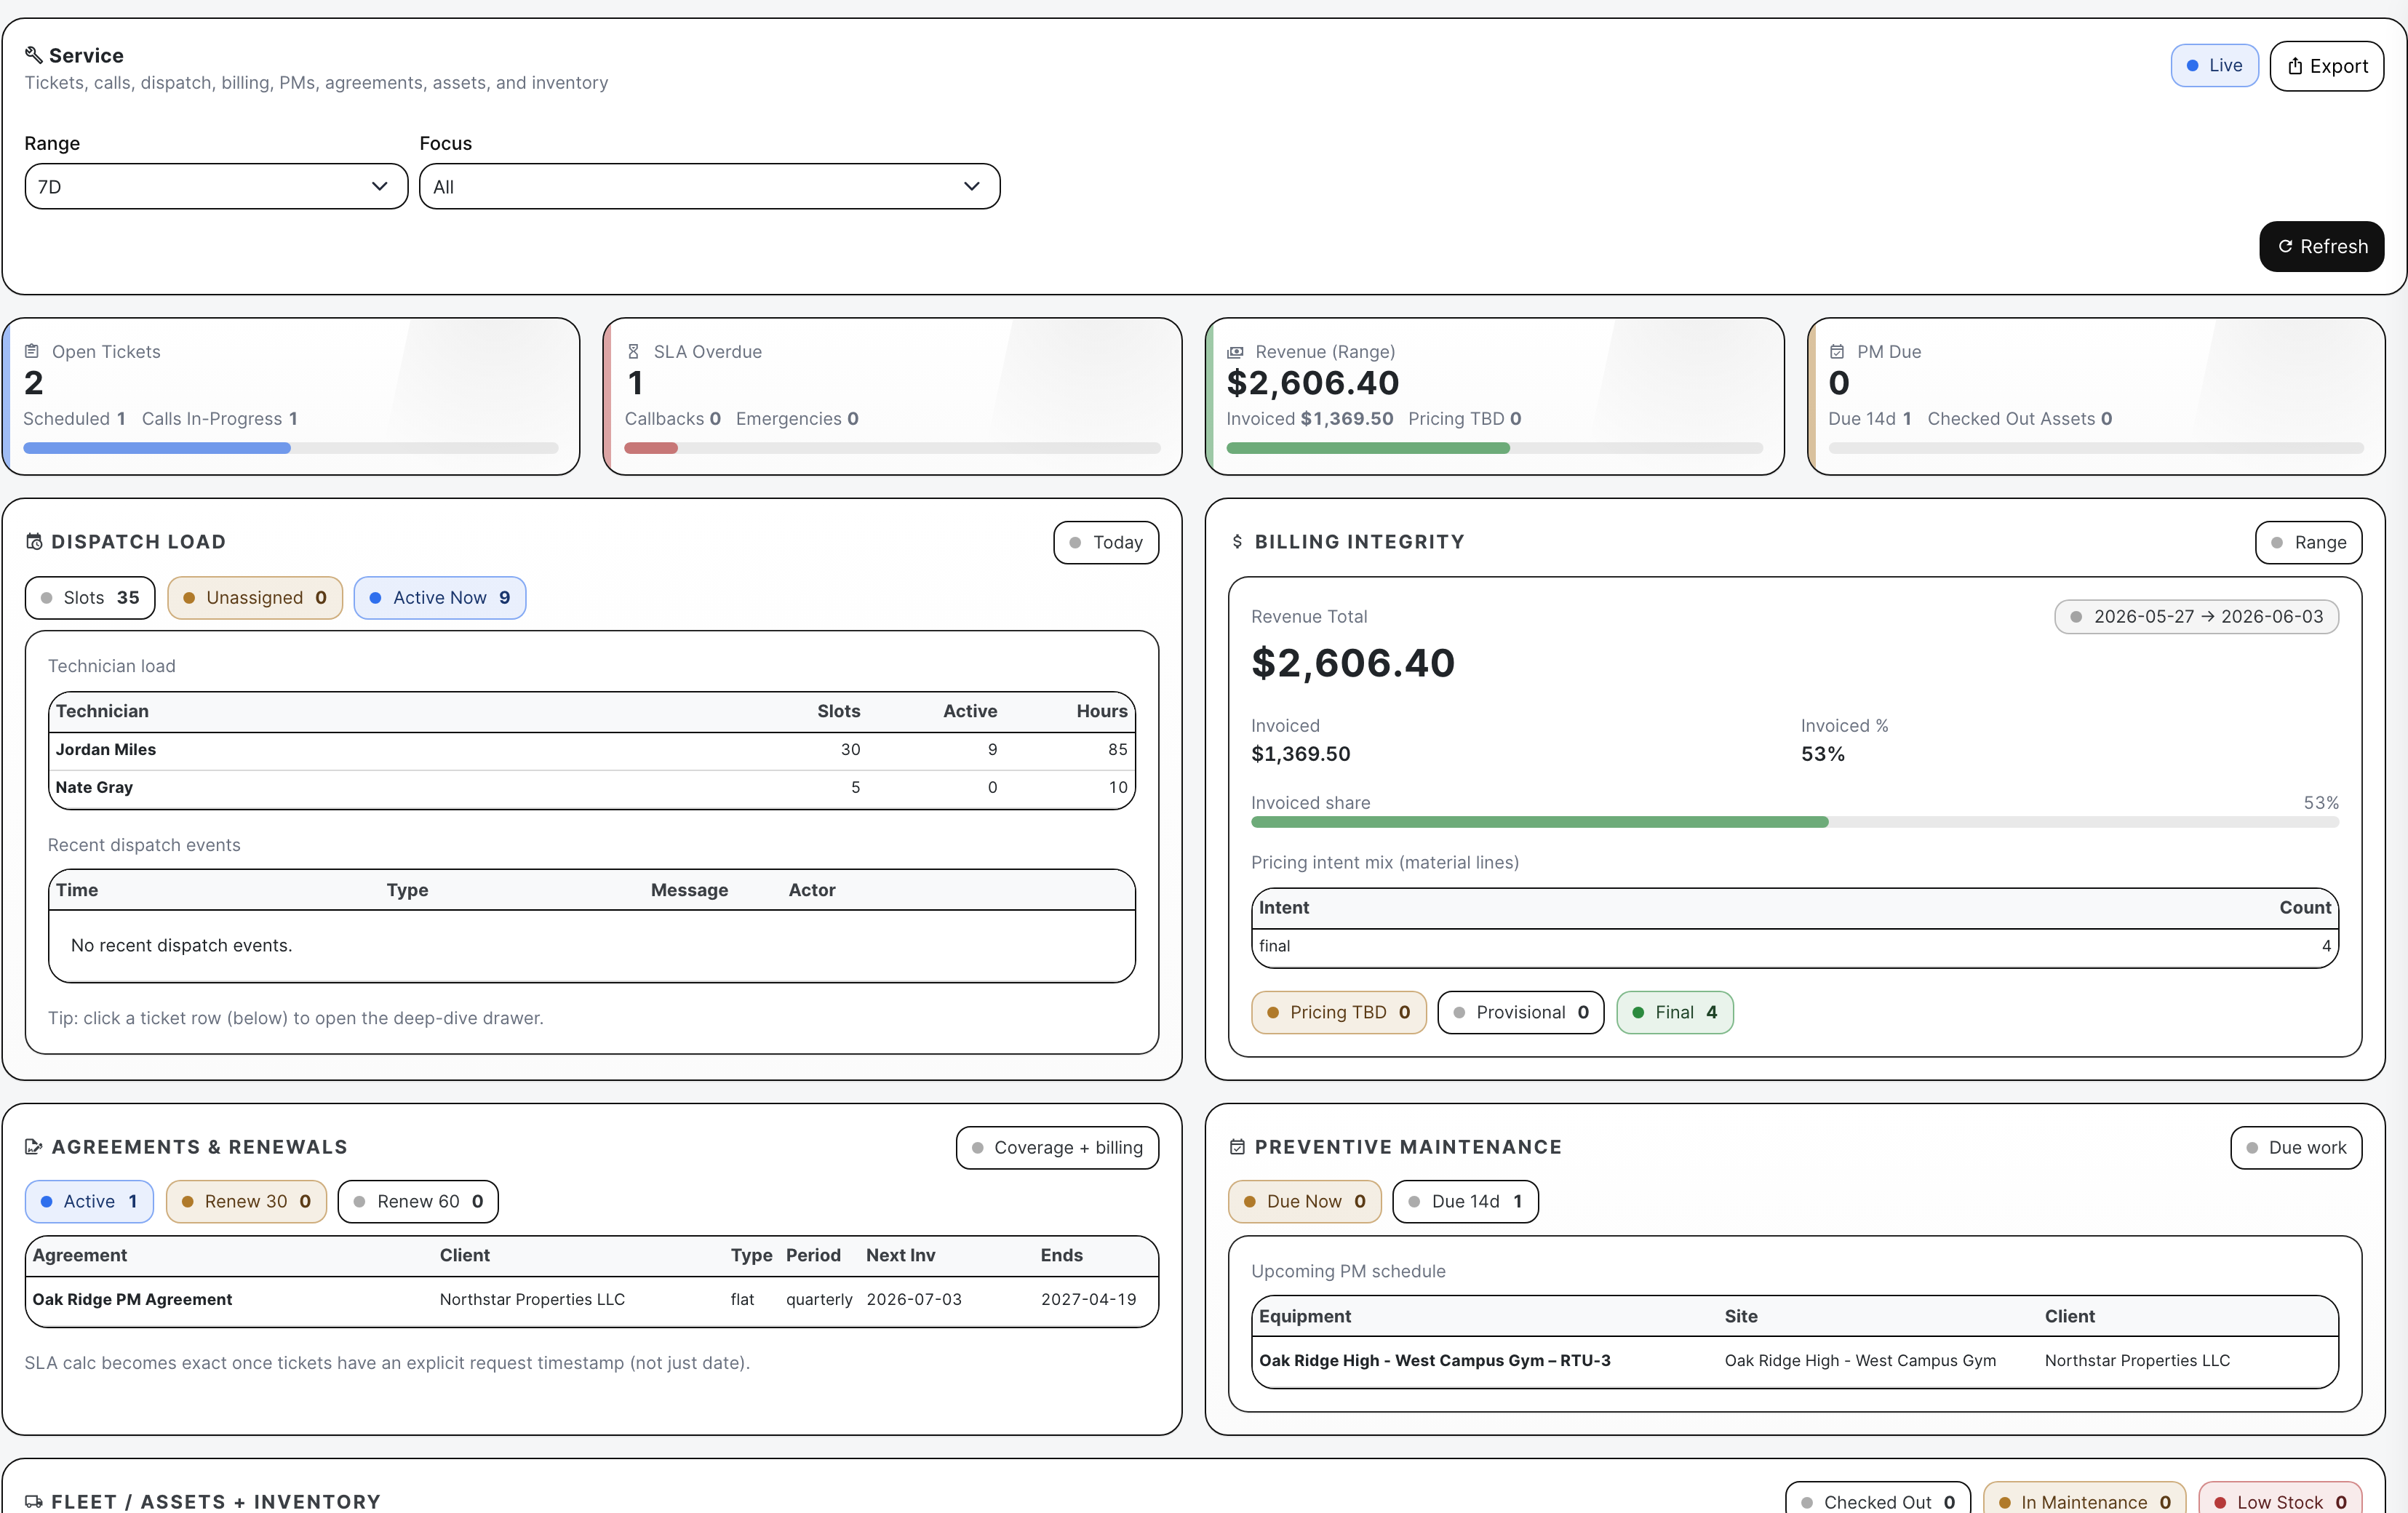
Project analytics ties job health to adjusted revenue, requisitioned work, paid/A/R pressure, overdue RFIs, blocked tasks, and attention-map cells. Service analytics adds the repair/PM side: open tickets, SLA overdue, dispatch load, billing integrity, agreements, PM due work, assets, and inventory pressure.

  • Find jobs where drift and A/R are landing in the same place
  • Review service tickets that need dispatch, invoice, PM, or agreement attention
  • Use the board as a management review, not a generic chart wall
Project analytics
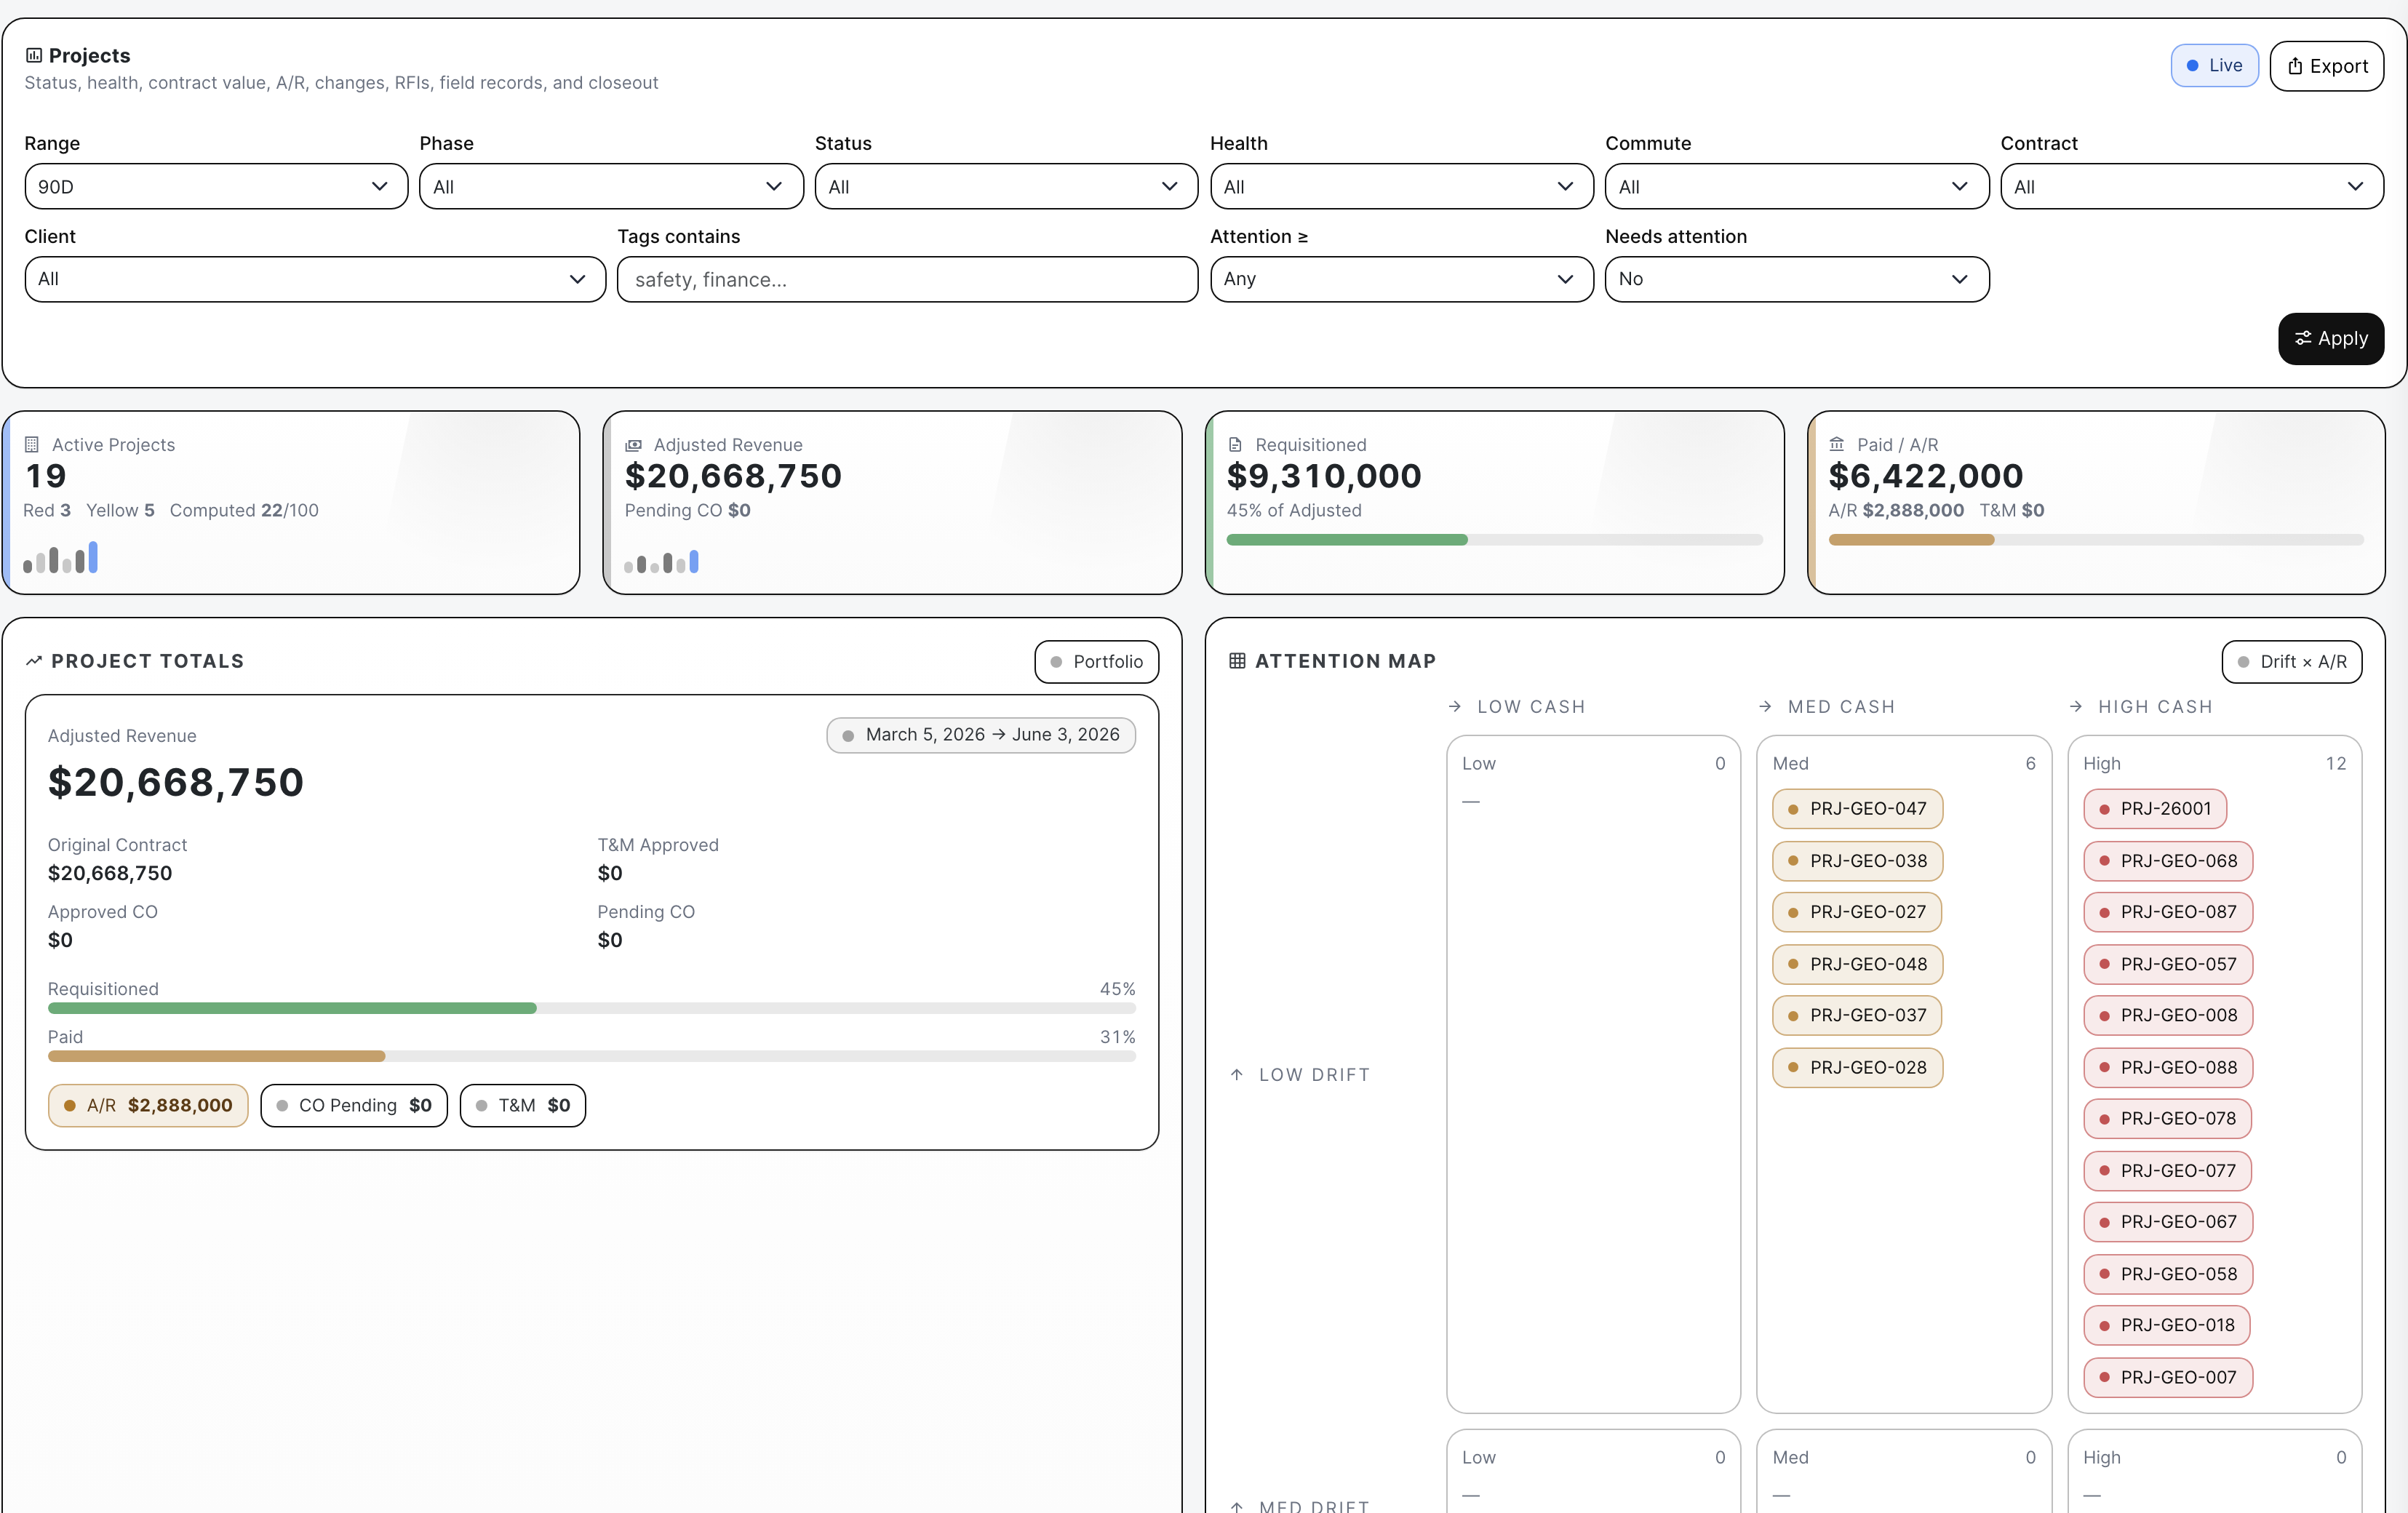
Project analytics connects commercial pressure to job risk.

Manpower: see conflicts before the field feels them

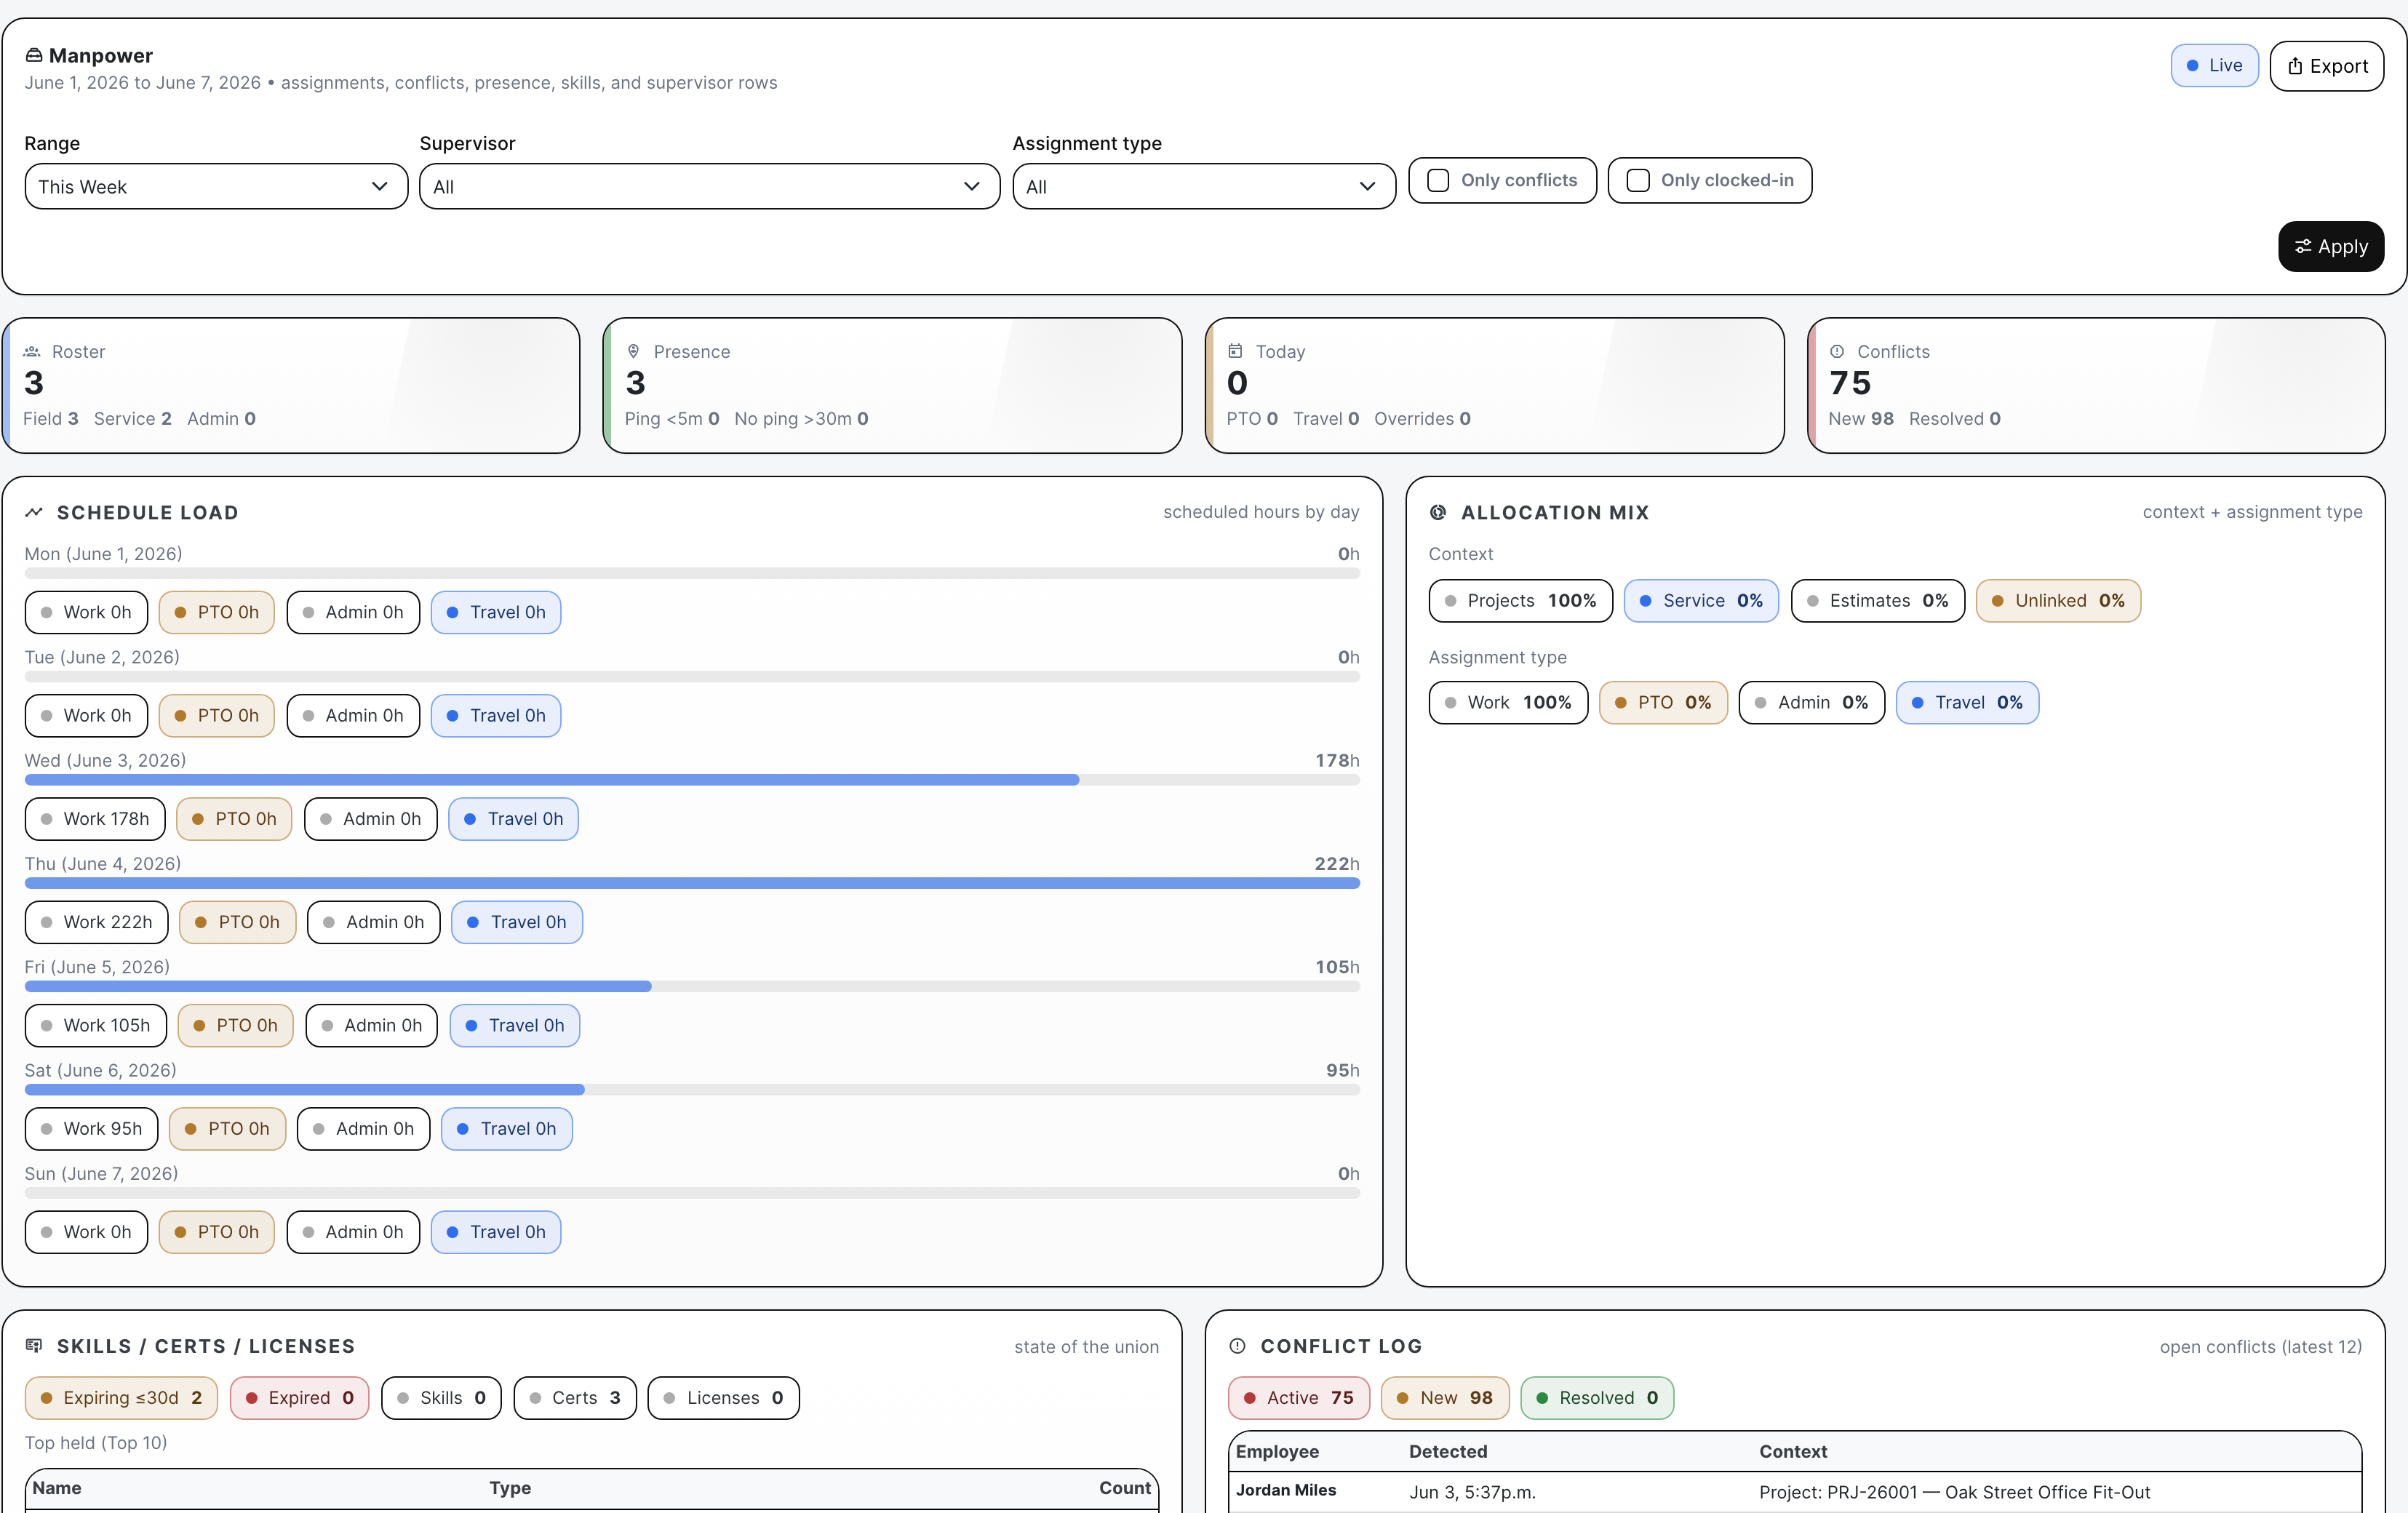
Manpower analytics reviews roster, presence, scheduled hours, allocation mix, supervisor groups, expiring credentials, and conflicts. The board is built for the question operations asks every week: who is double-booked, who is qualified, and where is the labor plan overloaded?

  • Review scheduled hours by day and assignment type
  • Catch active conflicts and expiring credentials
  • See project, service, estimate, overhead, and unlinked allocation mix
Manpower analytics
Manpower analytics keeps the crew plan honest.

Detailed Module Documentation

What is actually inside this module

Use this as the product-review checklist. Each item names a working surface or operational responsibility to inspect during a demo.

Leadership and sales

Start with company pressure, then inspect the department behind it.

Executive board Review cash, A/R, backlog, project risk, service pressure, follow-ups, and manpower capacity.
Lead analytics Review pipeline, weighted value, proposal coverage, owner load, sources, outcomes, and stale follow-up.
Geographic intelligence Map leads, estimates, projects, outcomes, value, heat, and market concentration.
Export Use supported CSV and GeoJSON outputs for follow-up and territory review.

Bid and project health

Turn a long record list into a management exception review.

Estimating board Inspect due windows, takeoff, pricing, proposals, RFIs, quote rate, bidders, and delivery readiness.
Project board Compare health, adjusted revenue, requisitioned work, paid/A/R, blockers, and overdue formal items.
Attention maps Group risk signals into practical records and categories.
Board checks Expose missing, overdue, blocked, or contradictory operating data.

Service and workforce

Review demand, billing integrity, and labor capacity together.

Service board Track open tickets, SLA, dispatch, billing, agreements, PM, assets, and inventory pressure.
Manpower board Review roster, presence, scheduled hours, allocation mix, conflicts, and expiring credentials.
Technician and supervisor load Compare assignments and demand by accountable person or group.
Operational drill-down Open the record that created the metric instead of stopping at the chart.

Analytics Proof

Actual Analytics boards with seeded contractor records

Executive analytics board with backlog, A/R, project, service, and manpower signals
The executive board gives leadership a single morning read: cash in, A/R outstanding, backlog value, critical signals, project risk, service pressure, and manpower capacity.
Lead analytics board with overdue follow-ups and pipeline value
Lead analytics shows open pursuits, pipeline value, owner load, proposal/value coverage, overdue follow-ups, and the lead rows that need attention.
Estimating analytics board with bid readiness blockers
Estimating analytics flags bid readiness problems like no takeoff, no price, no proposal, RFIs, due-window pressure, and RFP quote health.
Project analytics board with A/R and attention map
Project analytics ties risk to cash and field controls: active projects, adjusted revenue, requisitioned work, A/R, red/yellow health, and the attention map.
Service analytics board with dispatch load and billing integrity
Service analytics connects tickets, dispatch load, SLA overdue, technician slots, billing integrity, agreements, PM due work, assets, and inventory pressure.
Manpower analytics board with conflicts and schedule load
Manpower analytics shows roster, presence, scheduled hours, allocation mix, skills, expiring credentials, and open conflict rows before the schedule breaks.
Geographic analytics board with market hot spots and exports
Geographic analytics turns pursuit locations into hot spots, lead value, estimate value, saved views, CSV export, GeoJSON export, and map context.

Operating Rhythm

How a contractor uses Analytics during the week

Monday leadership review

Start with executive pressure, then send each department to the board that explains the number: leads, estimates, projects, service, or manpower.

Midweek rescue

Use board checks and filters to find the specific problem: overdue lead follow-up, missing proposal, high-risk project, SLA breach, billing gap, or crew conflict.

Market and backlog review

Use geography, backlog value, lead value, estimate value, A/R, and project health to decide where the company should chase, staff, or slow down.

Decision Coverage

Questions Analytics helps answer

Contractor needs BuildDaily does it
Which operating signals need attention today? Yes
Executive analytics shows cash in, A/R, backlog, critical signals, project risk, service pressure, pipeline flow, and manpower capacity.
Which pursuits are being neglected? Yes
Lead analytics shows open leads, weighted pipeline, value coverage, proposal average, owner load, overdue follow-ups, unassigned pursuits, and needs-attention rows.
Which bids are not ready to send? Yes
Estimating analytics highlights due windows, proposal send rate, bid readiness blockers, RFP health, quote rate, bidder/vendor behavior, and delivery status.
Which jobs combine risk and cash pressure? Yes
Project analytics reviews active projects, red/yellow health, adjusted revenue, requisitioned work, paid/A/R, attention-map risk, blocked tasks, overdue RFIs, and open items.
Which service work needs dispatch or billing cleanup? Yes
Service analytics tracks open tickets, SLA overdue, dispatch load, technician slots, revenue, invoiced share, pricing intent, agreements, PM due work, assets, and inventory.
Where is labor overloaded or double-booked? Yes
Manpower analytics reviews roster, presence, scheduled hours, allocation mix, conflicts, expiring credentials, supervisor rows, and capacity.
Where is work concentrated geographically? Yes
Geographic analytics filters mapped leads, estimates, projects, outcomes, heat, owner, department, sector, and tags, with hot spots plus CSV and GeoJSON export.

Review Flow

From leadership pressure to department follow-through

1

Read the executive pressure first

Leadership starts with cash, A/R, backlog, project red/yellow counts, SLA breaches, overdue follow-ups, and manpower conflicts to decide which department needs the first conversation.

2

Open the department board that explains the signal

A stale-pipeline signal goes to Leads, a missing bid signal goes to Estimates, a risk/cash signal goes to Projects, a ticket/billing signal goes to Service, and a double-booking signal goes to Manpower.

3

Use filters and tables to find the record behind the number

The boards expose filters, top blockers, needs-attention rows, attention maps, dispatch tables, conflict logs, and hot spot tables so managers can act on actual records.

4

Close the loop in the work module

Analytics points to the operational problem; the fix still happens in the connected module: assign the lead, finish the estimate, chase the RFI, invoice the ticket, or move the assignment.

5

Export when the meeting needs a handoff

Where the board supports it, managers can export board data, geographic CSV, or GeoJSON for owner meetings, territory reviews, and offline follow-up.

Contractor Scenarios

Analytics work that changes the next move

Owner morning meeting

  • Start with executive board checks for project criticals, SLA breaches, follow-up pressure, A/R, backlog, and manpower conflicts.
  • Open the matching department board only for the signal that needs action.
  • Leave the meeting with owners assigned to specific records, not a vague reporting discussion.

Preconstruction cleanup

  • Use Leads to find overdue follow-ups, unassigned pursuits, weak proposal coverage, and missing value.
  • Use Estimates to find missing takeoff, no price, no proposal, RFIs, low quote rate, and stuck bidders.
  • Use Geographic analytics to see whether pursuit value is concentrated in the right markets.

Project and service risk review

  • Use Projects to compare adjusted revenue, requisitioned work, A/R, health, blocked tasks, and overdue RFIs.
  • Use Service to review ticket pressure, dispatch load, SLA overdue, billing integrity, PM due work, and agreement coverage.
  • Decide whether the next move is a PM call, service dispatch change, invoice review, or project controls cleanup.

Crew capacity check

  • Use Manpower to see scheduled hours by day, allocation mix, conflicts, presence, roster count, and expiring credentials.
  • Find overlaps before moving people between project, service, estimate, or overhead work.
  • Keep labor planning tied to the same records that created the demand.

Walk through Analytics that tells a contractor where the work is slipping

We can walk through the module around the way your company actually handles the work.

See it with your work